Now that you have a foundation, here’s a quick and scientific way to pinpoint your optimal price. But before we delve into that, here are some quick reminders:
- Begin with your objective in mind. If your priority is growth, you may be willing to sacrifice profit to reduce CAC (I’ll explain how pricing affects it below).
- Conduct cohort analysis in controlled groups to ensure that pricing is the sole variable affecting changes in your customer acquisition and churn rates.
- Test rigorously and make it a data-driven process.
Step 1: Gradually increase prices. If you suspect you’ve underpriced initially, double your price, assess, and then double it again…
e.g. $50 → $100 → $200 → $400 → $800 → $1,600 → $3,200
Depending on your initial price point and the extent to which you’ve underpriced your offering, the difference between $50 and $100 may not be significant if your prospects are accustomed to paying around $1,000 for this solution. The doubling method will help you rapidly identify the range between what’s considered expensive and what’s seen as exorbitant. Within that range, you can refine your pricing with smaller, gradual adjustments.
Step 2: Measure and track CAC, Churn, and LTV. When increasing prices, you should generally expect to observe:
Higher CAC: the more expensive something is, the more challenging it is to convert prospects into customers. Why? Because
- Fewer prospects can afford or are willing to make a purchase.
- It might require more marketing dollars to convince them of your solution’s value.
- Prospects take more time to make a decision, and time translates to money.
- They may even need to consult with an SDR before committing. For instance, solutions priced over $300 usually necessitate at least one in-person interaction, which is more expensive than a solution sold entirely through marketing automation.
- There are complex formulas for calculating CAC. You don’t need to account for everything, but more details improve accuracy. At a minimum, advertising expense provides a simplified measure of CAC. For instance:
If you run Ad 1, spend $10, and acquire 10 customers. CAC = $1
Vs. Ad 2, spend $10 and only acquire 5 customers. CAC = $2
- Extended costs should also include the salaries of employees involved in all activities leading up to acquisition.
Higher Churn: Expensive prices may lead customers to seek cheaper alternatives, causing them to leave or discontinue your offering sooner.
While higher CAC and Churn may seem like negatives, they don’t always result in lower LTV. Let’s examine a hypothetical example for context:
Imagine, you’ve created an Uber-like platform that connects nannies/babysitters with parents who are looking for trusted temporary caregivers. Your business model is having babysitters pay $10/mo to use the platform to find childcare gigs. These babysitters stay on the platform for an average of 6 months. Average LTV = $10 X 6 months = $60.
As you gradually increase your price, churn will also increase proportionally. For example, now that you’re charging $80 a month, customers might only stay on your platform for an average of 3 months before leaving. This seems concerning at first, but consider this: the average Lifetime Value (LTV) is now $80 X 3 months = $240. A 4X increase! However, it’s also essential to consider how pricing affects customer acquisition. This price increase is justifiable if it doesn’t significantly impact our ability to acquire new users.
Maintaining this new pricing is logical if caregivers typically do not engage with the platform for more than six months. This could be attributed to the nature of temporary caregiving roles, which are often viewed as short-term transitional opportunities. That said, consider your context. Despite higher LTV, high Churn could disproportionately harm your business if you rely heavily on word-of-mouth or network dynamics (whereby when the more people use the platform, the more beneficial it is to everyone else) for growth.
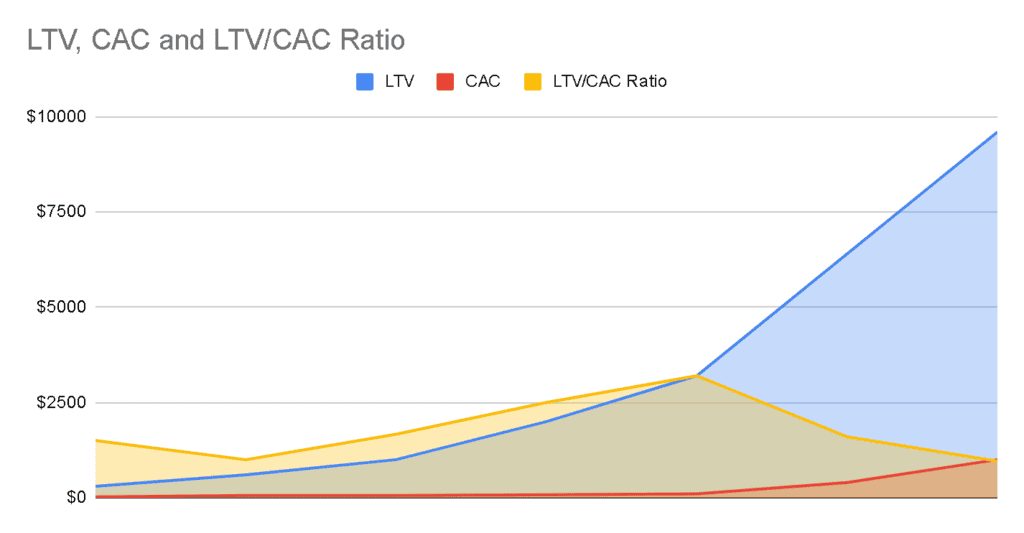
To help visualize this pricing “sweet spot”, track both the LTV and CAC associated with each price point on a spreadsheet. Here is an example of this in another hypothetical scenario:
| Price | Lifecycle (in months) | LTV | CAC | LTV/CAC Ratio (The higher the value, the better) |
|---|---|---|---|---|
| $50 | 6 | $300 | $20 | 15 |
| $100 | 6 | $600 | $60 | 10 |
| $200 | 5 | $1,000 | $60 | 16.67 |
| $400 | 5 | $2,000 | $80 | 25 |
| $800 | 4 | $3,200 | $100 | 32 |
| $1,600 | 4 | $6,400 | $400 | 16 |
| $3,200 | 3 | $9,600 | $1000 | 9.6 |
Here’s a graph of the above table for better visualization:

*Your graph may not reflect a similar pattern and may be more complicated if you have upsells/cross-sells.
Your goal is to find the price where you have the highest LTV to CAC ratio – this is where it is most profitable. You’re getting the most from them whilst CAC is minimal in comparison.
Yes, it’s scary. Increasing prices will make it harder to attract new customers and might even alienate existing ones. However, it’s important to remember that those customers who leave may not have been your ideal customers from the start. Additionally, you can consider segmenting and testing new pricing strategies within a smaller market, specific location, or through a particular sales channel before implementing a major change.
Increasing pricing might enable you to add more value to improve your offering, thereby better serving your customers. This could also potentially attract new prospects who previously overlooked your solution because it didn’t meet their needs or wasn’t sufficiently distinguishable from competitors.
